In November of 2009, I set up a sound level meter near a home in the vicinity of the Nutty Brown Cafe (NBC) in Dripping Springs to take measurements during a show. I did this in response to the public discussion about some of the Nutty Brown’s neighbors being upset by music from the amphitheater. Like many community noise topics, this discussion was becoming very emotional with increasingly negative and personal things being said by supporters of both sides, but with little to no technical facts as a basis. I summarized my measurements and compared them to a handful of meaningful criteria in a post on Austin Noise. The measurements I took showed, pretty clearly that, in that location, sound from the Nutty Brown could be considered loud and disturbing. Conversations followed my article on various websites, including this one, and at one point I mentioned that, due to the amount of high frequency noise escaping the venue, there may actually be some things that could be done to reduce the noise impact of the venue on the neighborhood.
A few months later I heard from Mike Farr, the owner and operator of the Nutty Brown Cafe. He offered to bring me on as a consultant to help find ways of reducing the amount of sound reaching neighbors from the amphitheater. Here was a chance to actually work on the problem directly, instead of just talk about it on a website. I gladly accepted but included the condition that, when all was said and done, I would be able to write about my experience on Austin Noise. Here is that article. Make sure you have some time, because this is a long one.
The first step was to meet with Mr. Far and Mr. Smith, the contractor in charge of configuring and operating the sound equipment at the amphitheater. I learned that community noise had been a concern since the time the stage had been erected, and that they had tried various techniques at containing sound. They had chosen flown arrays over stage-sitting stacks of speakers for their ability to be pointed down, and they had tried alternate scrims to cover the speakers in hopes of achieving better diffusion or otherwise alter the propagation path of sound from the arrays. They had also tried some other measures that I don’t recall the specifics of. Some of their attempts had yielded success, but without objective measurements at receiving locations, they relied mostly on response from the community for feedback (still a valid source of information).
Probably the most dependable technique they employed was to watch property line noise levels closely, with measurements at regular intervals. Originally they attempted to keep property levels at 80 dBA or less. Currently they strive for 75 dBA.
After a few meetings, I devised a plan and Mr. Farr approved it. The first step was to attempt to establish where the music was bothersome geographically. I published a survey on this website that asked people living within a few miles of the cafe to report where they lived, whether music from the cafe was bothersome to them and, if so, what qualities of the music was bothersome. About 20 people responded with usable information, which was enough to give a general sense of where people were being disturbed.
In internet conversations the residents of Belterra were frequently blamed for being unreasonable complainers. Belterra residents were cast into a role of being newcomers who bought a house near the Nutty Brown and then proceeded to complain about it. I had my doubts about this, as the geography didn’t really match that scenario. The survey (and the later filing of a TABC complaint by a group of homeowners) confirmed my suspicions. I received more pro-NBC responses from Belterra than any other neighborhood, and all but one of the complainants lived in old neighborhoods to the northwest.
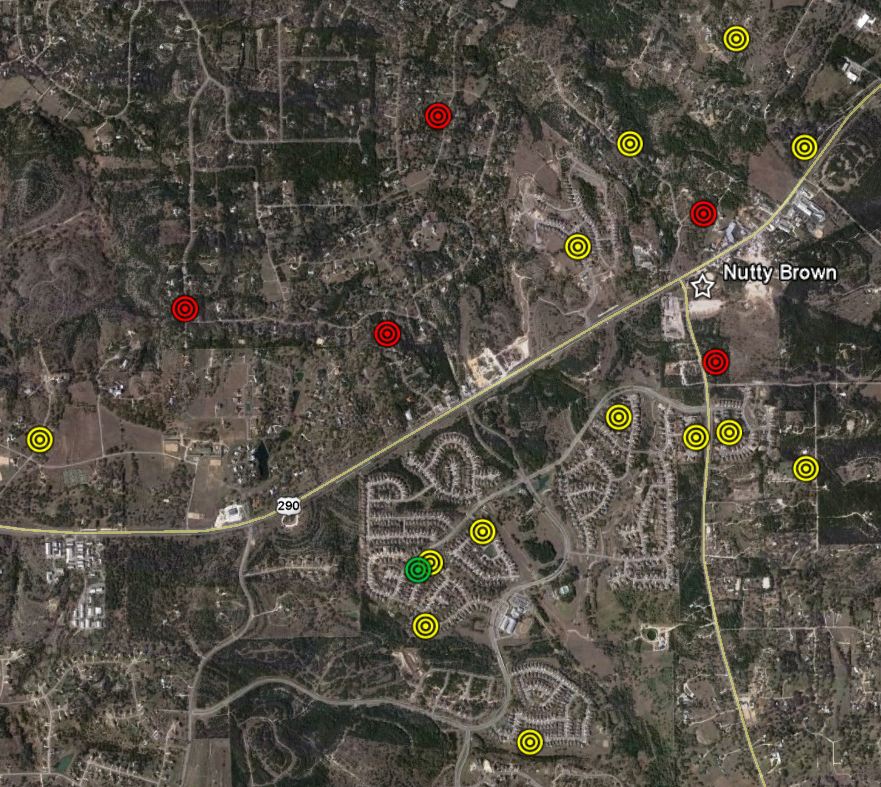
The first survey question was simply “can you hear music from the Nutty Brown?” The responses are shown below. Each circle is the location of someone answering the survey. A green circle means they can’t hear the music at all (there are more of these outside the frame of this image). A yellow circle means they can hear the music but aren’t bothered by it (some of the people from Belterra answered that they like that they can hear it). A red circle means they find the sound bothersome.
The stage faces WNW.
The survey had a fairly predictable outcome. People bothered by the music are either close to the venue or in the “line of fire” of its speakers.
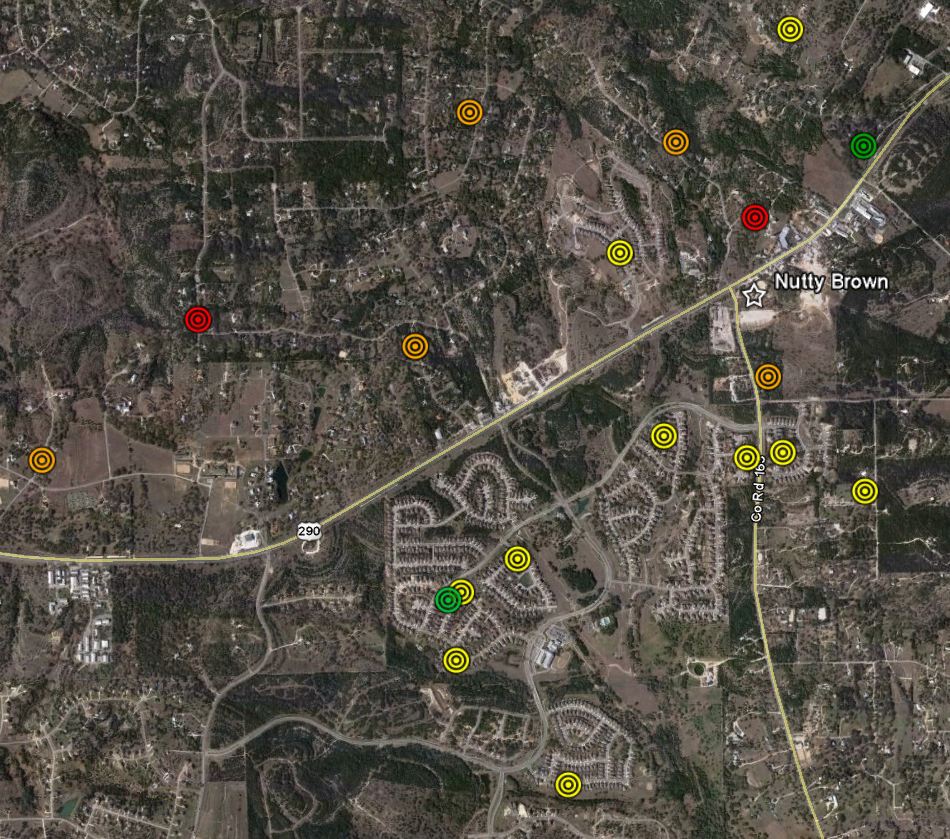
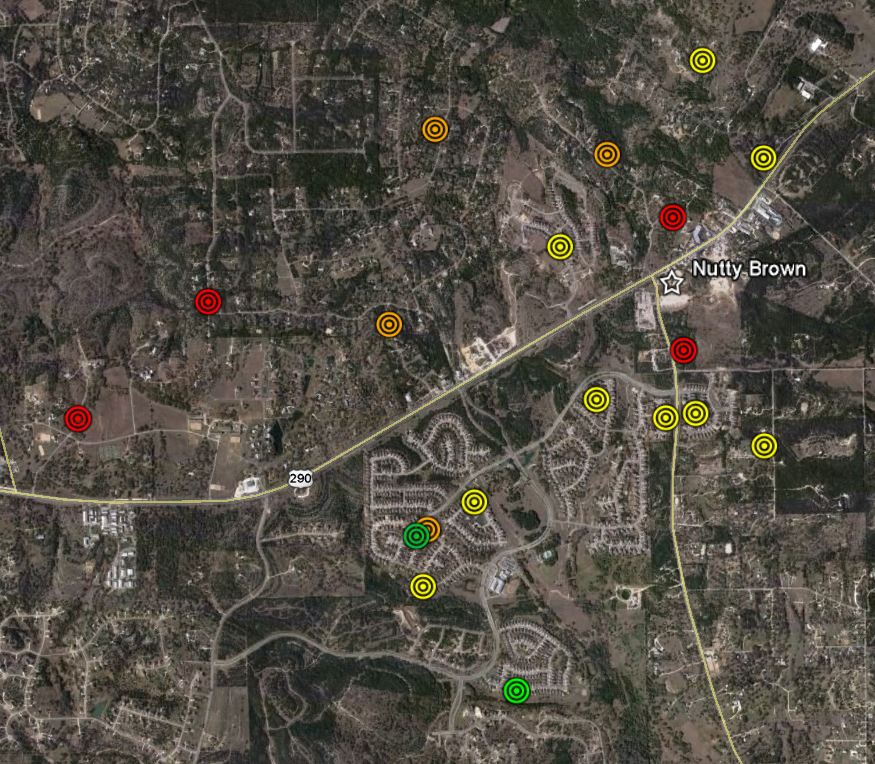
The next two questions dealt with the audible qualities of the sound. I asked people to consider high frequency noise (cymbals, vocals, guitars) and low frequency noise (kick drum, bass guitar) separately. A green circle means the sound is inaudible. A yellow circle means it’s audible outdoors but not indoors. An orange circle means it’s audible indoors. A red circle means it’s clearly audible indoors.
Here is the high frequency audibility map.
And here is the low frequency audibility map.
The results are, again, somewhat predictable. Low frequency has better carry and is better able to penetrate building shells. What was surprising was how far away high frequency noise can be heard, even indoors. This suggests that special ground and atmospheric effects are at work to carry the sound further than it would be able to carry over a plain, flat surface.
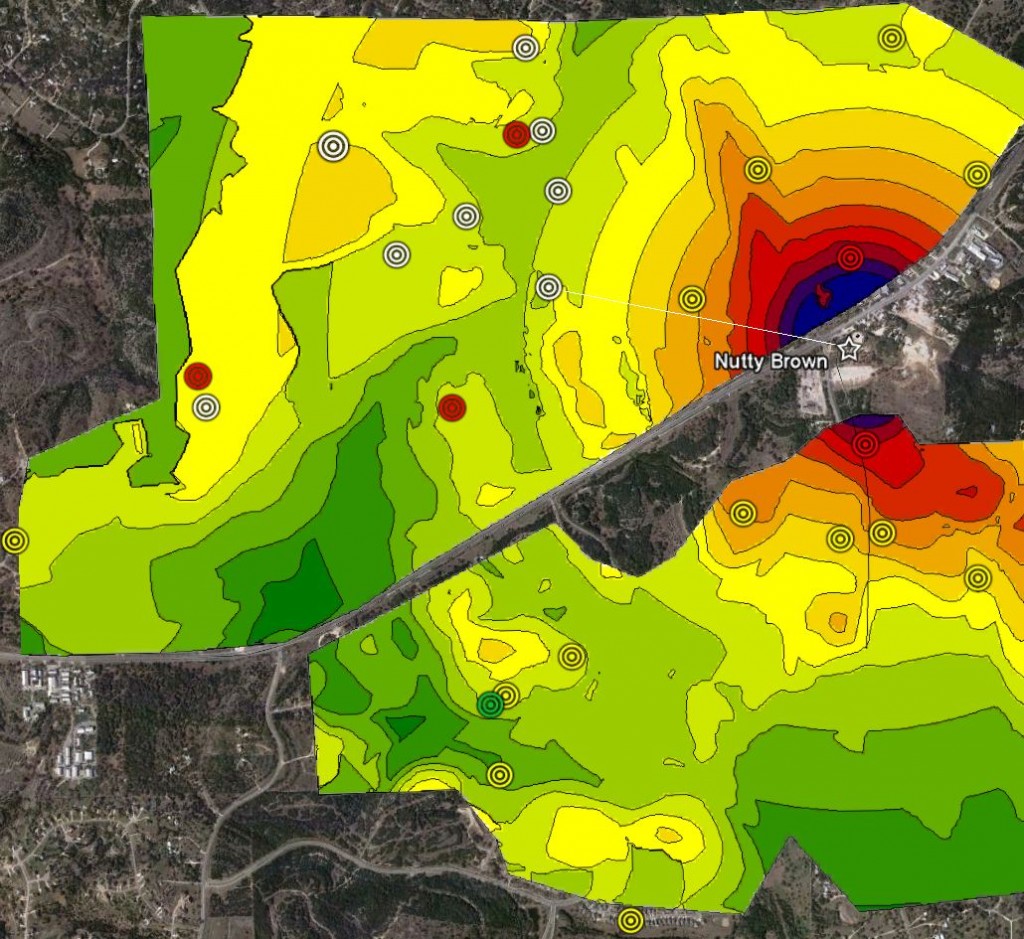
To attempt to find a link between the geography of the area and the locations of houses where the sound is audible, I constructed a computer model of the area using SoundPLAN acoustic modeling software. I built the model using elevation data from the USGS, and built a “stage” at the location of the Nutty Brown with a couple of simple noise sources to represent the arrays and subwoofers. When I superimposed the approximate locations of survey respondents things became more interesting.
SoundPLAN does not consider unusual atmospheric effects, but it does consider the effects of roads and valleys. Based on ground shape alone, it looks as though people who can hear the music tend to live in locations that receive more sound energy than others. if you follow the contours away from the stage towards the northwest, you can see that the noise drops off from red to green, but then picks up again, all the way back to orange in some places. Due to the specific changes in elevation, noise is able to reach these “hot spots” more efficiently than if it were just traveling over perfectly flat land.
In this figure the yellow, red, and green circles are the results of the “can you hear” survey, and the white circles are the approximate locations of some of the protestants against NBC’s liquor license. Notice that the red and white circles almost all land on a hot spot (or the leading edge of one). I will come back to this concept later in the article.
This is important because it helps to explain the sharp divisions between people living in the area between those who are bothered by the sound and those who are not. Due to the complicated geography of the area, it’s possible for people living only a few hundred feet from each other to have very different experiences. To some, the sound may be barely audible, or even inaudible, while to their neighbors the sound may be clearly audible. This is not an intuitive situation, and it’s easy to imagine people who receive little sound energy considering those who complain about the sound to be unreasonable or overly sensitive.
At this point it was clear that there would be no easy answers.
The next step was to take some real, live sound measurements. I set up one sound level meter (SLM) at the mixer, which took measurements automatically every minute. I took another SLM with me out to several locations. The clocks of the two SLMs were synchronized, so that I’d be able to compare measurements taken in the two locations for any given minute. Looking at the difference in simultaneous sound levels between the mixer and the measurement position gave me a way to make direct comparisons between different locations. Just looking at absolute levels does not afford that, as absolute levels change minute to minute and song to song.
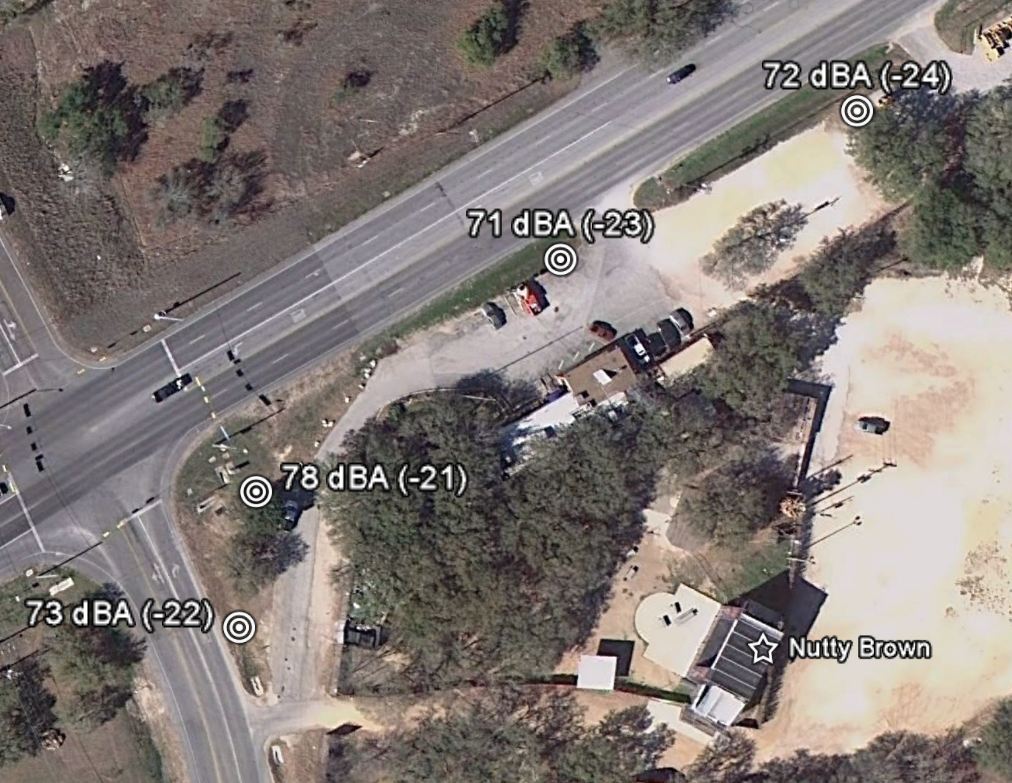
The first set of measurements I took was on April 9th for Pat Green. For this show the NBC’s arrays were not used. Instead a stack on the stage was used along with subs placed at ground level (normally they would be on the stage). I took a set of measurements around the property line, and then at 3 locations out in the neighborhood. Shown on the figures below are the absolute values of the measurements in dBA Leq, and the relative change between the mixer and the measurement location (appearing as “-22” or similar).
The property line measurements vary by 7 dBA in absolute terms, but their values relative to the mixer were very consistent. You can see that the measurement to the north benefits slightly from the shielding of the building, and the off-axis measurement in the northeast is 3 dBA lower than the measurement that’s in line with the stage.
Measurements in the neighborhood were taken at two different times, early in the show and later. I was unable to get a second measurement at the west location because a dog decided to bark every time I turned on my meter.
The variation between the two measurements at the north location were due to a significant change in wind speed. The road that those measurements were taken on, Oak Branch Dr, runs through a valley that seems to funnel wind efficiently, wind that carries sound. This was another example of why this project is so complicated.
I took another set of measurements on April 30th for Clint Black. This time the normal line arrays were in use, and the subwoofers were once again placed on the ground in front of the stage. Just as I finished my property line measurements, Clint Black launched into a long acoustic guitar set that was simply not audible out in the neighborhoods. This left me with usable data only along the property line.
The absolute levels are considerably lower than they were for Pat Green, which was expected because Clint Black is simply a quieter show. The relationship of the relative levels tells us more. Now the off-axis measurements show less of a difference between the board and the measurement location than the on-axis locations. This is easily explainable by examining the differences between the speaker types used in the two shows. For the Pat Green show, traditional looking speakers were set on the stage and pointed forward, over the crowd, so more sound energy will leave the venue along the line of the stage. Wideline arrays were used for the Clint Black show, which were flown high and pointed down at the ground. This reduced the amount of sound leaving the venue on-axis, but wideline arrays send more sound energy sideways, and they were flown higher, which resulted in more sound energy reaching the off-axis locations.
These results gave me a few hints and I went to work developing ideas for mitigation.
For developing mitigation ideas, I relied very much on my SoundPLAN model. SoundPLAN allowed me to make changes to the venue, such as speaker height, and enclosures, and see what the expected benefit was at receiver locations.
The first mitigation measure I explored was simply moving the sub-woofers from the stage to ground level. Mr. Smith had already discovered that putting the subs low meant that more sound energy was absorbed by the crowd. It also meant that any walls or structures providing shielding would have added benefit due to the increased height differential. I set the SoundPLAN model to run scenarios with the subs both on the stage and on the ground, and determined a likely amount of benefit this move would provide based on location.
| dBA | 31 Hz | 63 Hz | 125 Hz | 250 Hz | 500 Hz | 1 kHz | 2 kHz | 4 kHz | |
| Oak Branch Dr | 2 – 3 | 6 – 9 | 6 – 9 | 3 – 6 | 1 – 2 | 0 | 0 | 0 | 0 |
| Ledgestone | 0 – 1 | 1 – 4 | 1 – 4 | 1 – 4 | 1 – 2 | 0 | 0 | 0 | 0 |
| Carriage House Ln | 0 – 1 | 0 – 3 | 0 – 3 | 1 – 4 | 1 – 2 | 0 | 0 | 0 | 0 |
| Belterra | 0 – 1 | 3 – 6 | 3 – 6 | 2 – 5 | 1 – 2 | 0 | 0 | 0 | 0 |
| NB Road | 0 | 0 | 0 | 0 | 0 | 0 | 0 | 0 | 0 |
The table above shows results for 5 locations in dBA and in octave frequency bands starting at 31 Hz. It’s important to consider the octave bands individually, especially when dealing with subwoofers, which barely register on an A-weighted scale, but are still plainly audible.
This analysis predicted excellent improvement for off-axis locations (Oak Branch Dr and Belterra), but nothing exciting for on-axis. What the model did not consider, and what Mr. Smith had already discovered, was that placing the subs at ground level benefits from the presence of human bodies. In reality, this measure improves low frequency containment much better than the model predicts. Based on Mr. Smith’s experience and the off-axis predictions, I recommended that subs always be kept at ground level. They probably would have done this whether or not I had recommended it.
My next recommendation was to enclose the backs and sides of the arrays with absorptive shields. These shields would be meant to protect homes to the sides and back of the stage, but would have no benefit for homes in the stage’s primary direction. The model predicted benefits of between 1 and 9 dB in various octave bands for locations to the sides of the stage. To my knowledge, side and back shields for the arrays have not been implemented.
I suggested implementing a monitoring system, so that sound engineers controlling the show volume would have a benchmark to set their levels by. Sound monitoring systems can take measurements at key locations and report levels to the mixing position in real-time. While there are fancy, high tech, and expensive noise monitoring solutions available, Mr. Farr’s method of taking property line noise measurements at regular intervals seems to do a decent job of keeping sound levels consistent.
The arrays in use by the NBC (QSC Wideline) are known for a particularly wide dispersion pattern, so I suggested switching to an array with a horizontally narrower dispersion pattern, to reduce the off-axis noise impacts. Admittedly, this is a very expensive step to take and I would guess that this suggestion will not be implemented any time soon, if at all.
The type of mitigation that I spent the most time studying was the implementation of noise barriers around the amphitheater boundaries. Noise walls are the typical go-to mitigation for outdoor noise problems, because they are often the only thing that’s effective. Despite their high cost, Mr. Farr showed interest in erecting barriers, as long as they provided a meaningful benefit.
I used SoundPLAN to calculate the possible benefits of surrounding the amphitheater with 10-foot, 13-foot, and 16-foot barriers. The values in the following tables should all be considered +0 to +3.
10-foot barriers were not predicted to provide much benefit. This was expected.
| 10-foot Barriers | dBA | 31 Hz | 63 Hz | 125 Hz | 250 Hz | 500 Hz | 1 kHz | 2 kHz | 4 kHz |
| Oak Branch Dr | 1 | 7 | 7 | 2 | 1 | 0 | 0 | 0 | 0 |
| Ledgestone | 1 | 1 | 1 | 1 | 1 | 0 | 0 | 1 | 1 |
| Carriage House Ln | 0 | 0 | 0 | 1 | 1 | 0 | 0 | 0 | 0 |
| Belterra | 1 | 3 | 3 | 1 | 1 | 0 | 0 | 0 | 0 |
| NB Road | 0 | 0 | 0 | 0 | 1 | 0 | 0 | 0 | 0 |
13-foot barriers were an improvement, but still nothing substantial, especially when their cost is considered.
|
13-foot Barriers |
dBA |
31 Hz | 63 Hz | 125 Hz | 250 Hz | 500 Hz | 1 kHz | 2 kHz |
4 kHz |
| Oak Branch Dr |
3 |
7 | 7 | 2 | 2 | 1 | 2 | 3 |
3 |
| Ledgestone |
4 |
1 | 1 | 0 | 1 | 1 | 2 | 2 |
3 |
| Carriage House Ln |
0 |
0 | 0 | 1 | 1 | 0 | 0 | 0 |
0 |
| Belterra |
3 |
3 | 3 | 1 | 1 | 0 | 3 | 5 |
5 |
| NB Road |
0 |
0 | 0 | 0 | 1 | 0 | 0 | 0 |
0 |
16-foot barriers, which would be very expensive, showed barely any improvement over the 13-foot option.
|
16-Foot Barriers |
dBA |
31 Hz | 63 Hz | 125 Hz | 250 Hz | 500 Hz | 1 kHz | 2 kHz |
4 kHz |
| Oak Branch Dr |
3 |
7 | 7 | 2 | 2 | 1 | 2 | 3 |
3 |
| Ledgestone |
4 |
1 | 2 | 1 | 1 | 2 | 3 | 4 |
6 |
| Carriage House Ln |
0 |
0 | 0 | 1 | 1 | 0 | 0 | 0 |
0 |
| Belterra |
3 |
3 | 3 | 1 | 1 | 0 | 3 | 5 |
5 |
| NB Road |
0 |
0 | 0 | 0 | 1 | 0 | 0 | 0 |
0 |
Disappointed in the predicted benefit of the barriers, I looked deeper at the problem to see why the model was downplaying their effectiveness.
At about this time the protest against the NBC’s liquor license had grown from one party to ten. So I began analyzing strictly in terms of the locations of the protestant’s homes, as it was reasonable to assume that their locations had the most noise exposure in the area.
I ran hand calculations of barrier effectiveness for the individual locations of the TABC protestants and came up with similar results to my SoundPLAN model. I decided that several factors reduced the predicted effectiveness of barriers in this situation. First and most important, the distance between the stage and the back wall of the amphitheater is too great. For a noise barrier to be most effective, it must be close to either the source or the receiver. Compared to the distance between the wall and the receiver, the distance from the stage to the wall is short. But, it’s not a question of relative distances, it’s a question of the physical properties of sound, namely wavelength. The distance from the source to the wall must be short with respect to the wavelength of sound. In other words, the barrier would need to be closer to the stage to be effective.
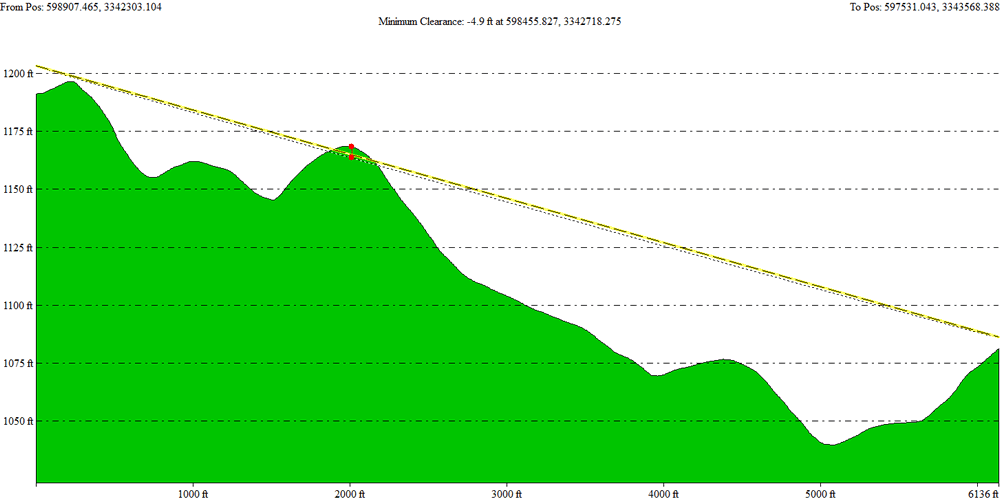
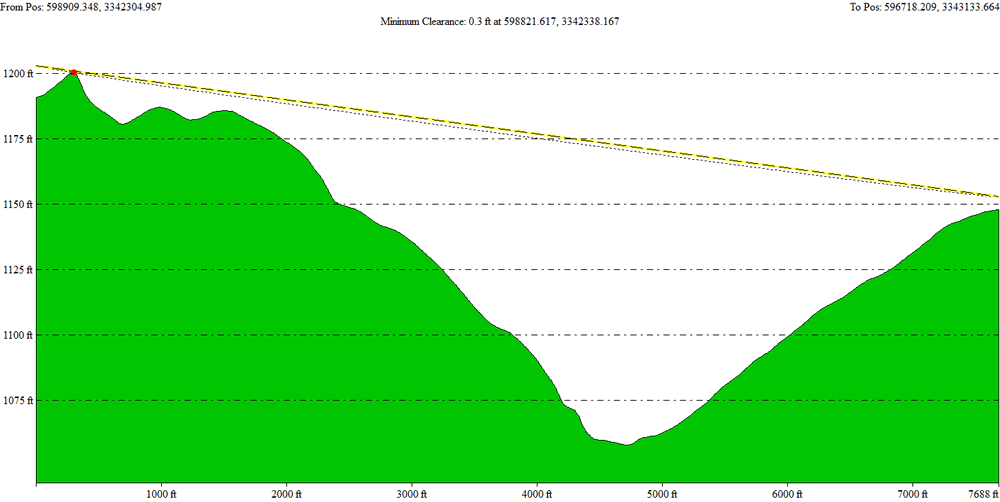
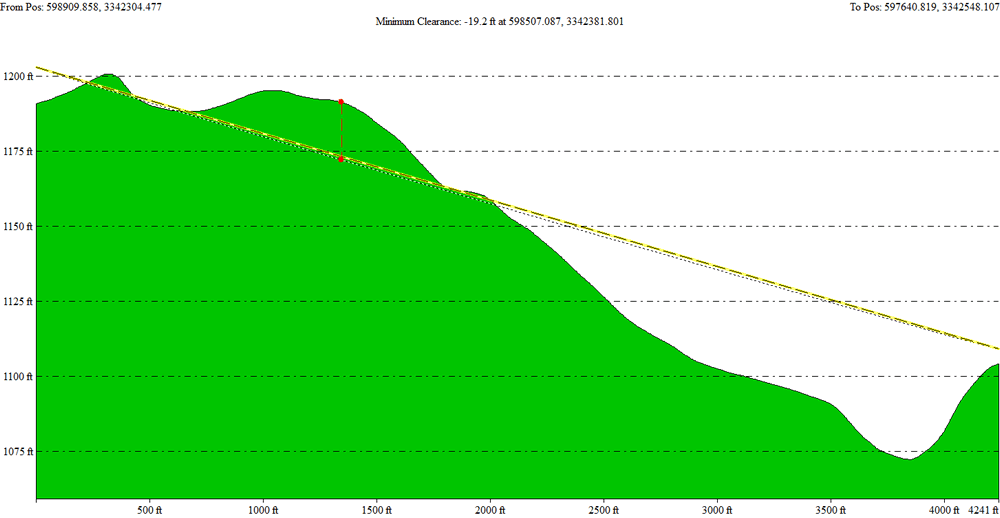
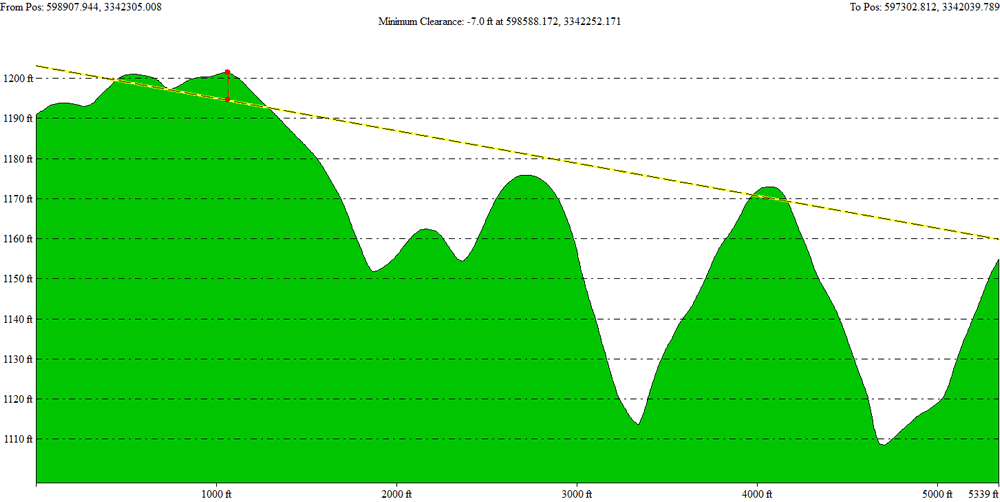
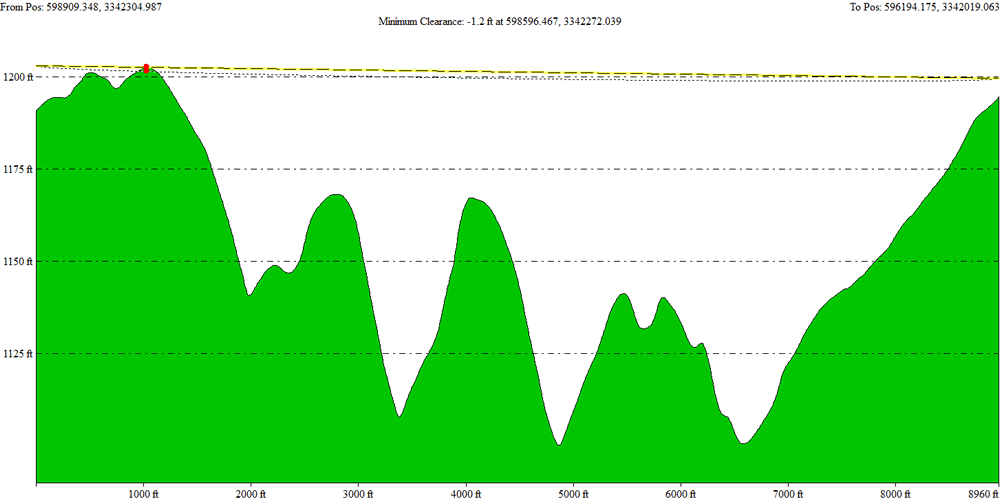
Next, and probably more interesting, the pathway between the stage and the locations of the protestants is not generally a straight line. I discovered this by looking at a cross section of the terrain between the stage and the location of each protestant. A barrier is most effective when it breaks the line of site between the source and the receiver. By looking at each pathway with respect to elevation, I discovered that the line of site was already broken by terrain. Sound is following a round-about path between the stage and the complainants, so it’s difficult or impossible to know if a barrier would have any effect at all without actually building one.
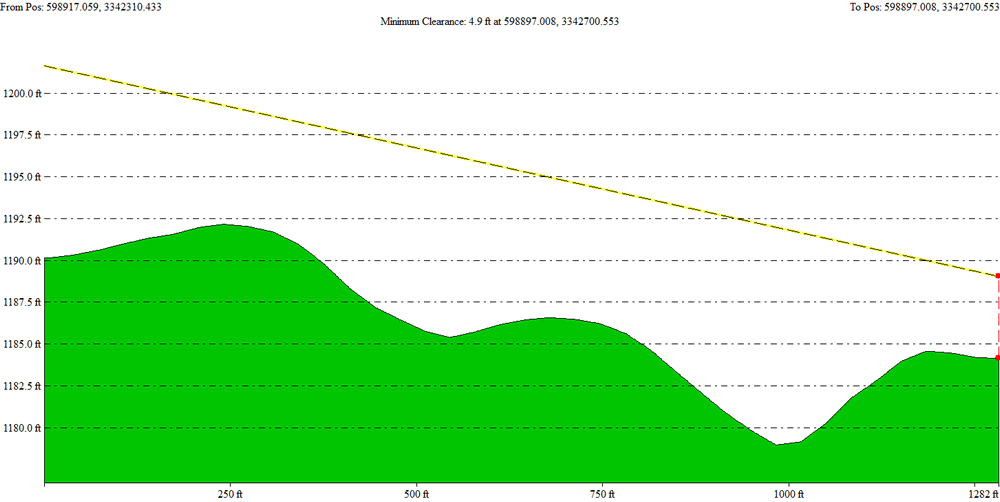
While looking at the terrain cross-sections, I noticed a pattern emerge. For all but 2 of the locations of the protestants, the same basic terrain pattern between the stage and the receiver was evident. The following cross-sections were created with Global Mapper 12. They show the path between the stage on the left to the protestant’s home on the right. Note that in every case the path is downhill and in all but one case the sound passes over valleys. When sound propagates outdoors, it is usually absorbed by grass or soil as it passes over the ground. This is called ground absorption, and it accounts for a significant amount of sound attenuation over long distances. When the sound is free to pass over an open space, or when it passes over a reflective surface (such as the surface of water), the ground absorption effect is reduced or eliminated.
You may also have noticed that in 9 of these cases the receiver is located on the front edge of a hill. The similarity of the topography of these cases is striking. As I said in the early parts of this article, it’s possible for people living only a few hundred feet away from one of these protestants might have a completely different experience. I think that most of the protestants having very similar pathways between their homes and the stage lends credence to this idea.
It was disappointing to not be able to hand Mr. Farr a simple solution to the noise problem. I had hoped that we could find a barrier arrangement that would have provided significant noise reduction for all of the protestants. Unfortunately the complicated terrain and atmospheric effects make it unlikely that barriers will provide much benefit. After a summer of working on this project, I did not have the magic solution, only a number of smaller ideas that, when added together, could make a difference.
A year after the April Pat Green show, Mr. Farr asked me to conduct another set of measurements to evaluate some additional changes they’d made to their venue.
They had abandoned the use of their 10″ QSC Wideline arrays and had only been using the 8″ arrays (previously they used both, depending on the size of the crowd). They had also elevated the arrays higher and pointed them down at a sharper angle towards the ground. This takes advantage of the high directivity of the array drivers, sending more sound energy into the crowd and the ground, and less over the top of the venue walls. These changes appear to have made a marked improvement on the noise levels outside the venue.
Another change they made that I find very clever (I wish I’d thought of myself) was to move the mix position much closer to the stage. This causes the sound engineer on the mixer to be exposed to higher sound levels and, theoretically, will result in him mixing to a lower volume. Such a simple idea, and I believe it can be very effective at keeping certain “rogue” sound engineers in line with their goal of lower noise.
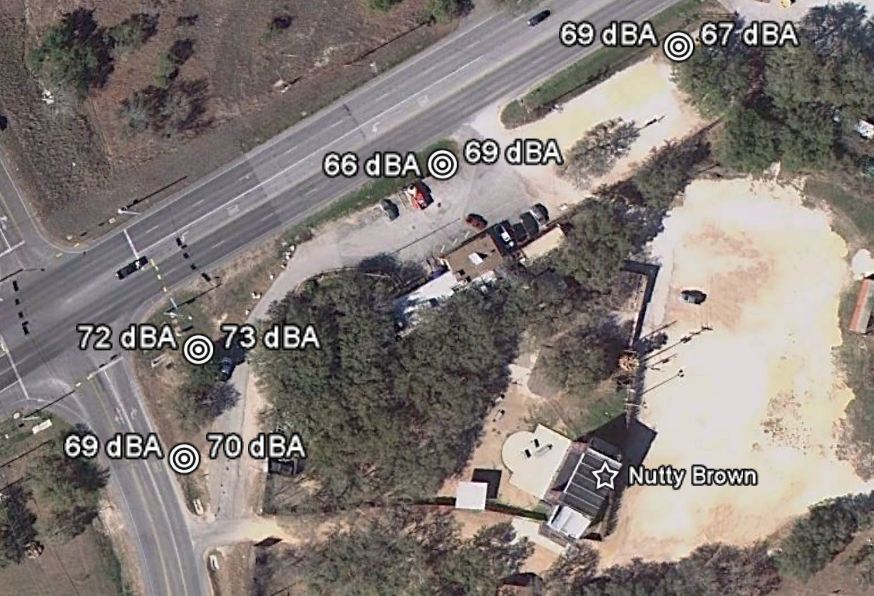
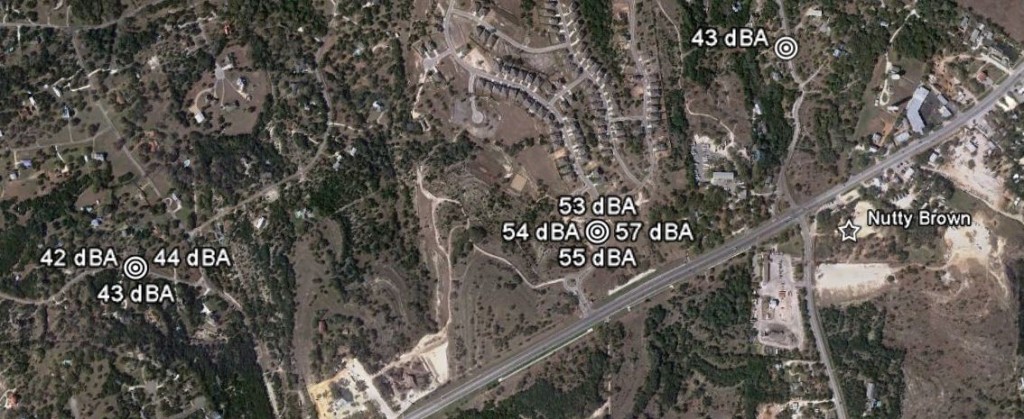
I took two rounds of measurements on April 27 of this year with the following results. I did not have a second SLM to leave at the mixer for relative levels.
These property line levels are similar to what I had measured a year earlier for the Clint Black show. The difference is this was not a particularly quiet show, like Clint Black puts on. This show was at a “normal” volume level inside. The modifications made to their array appears to have earned them a reduction of 3 or more dBA at their property line.
These levels are noticeably lower than those I measured at the Pat Green show. Improvements range from 4 to 12 dBA. Remember that these numbers can change from minute to minute and show to show, so making a numerical declaration would be irresponsible without more data to consider. But actually being at the site and hearing the difference, it seems like the changes made to the venue have made a real improvement.
It is unfortunate that I was unable to take another set of measurements that I could directly compare to the first set of measurements I took in 2007. Knowing the amount of effort the NBC has put into finding workable solutions, I am certain that a second set of measurements would result in lower levels. How much lower, I can’t say for certain, but something on the order of 5 to 10 dBA seems very possible.
I wrote this article with more of a personal tone than I typically use at Austin Noise. For one thing, there’s far too much data to be able to present it all in one coherent document, so it was necessary to summarize my findings in a quicker and looser fashion than normal. But, more importantly, this project was a personal experience for me in a way that can’t be presented as a technical paper.
I spent a decent amount of time working with Mr. Farr and his staff, but I also spent time working and communicating with the other side. In particular I worked mostly with Ana and Manuel Pena, who I found to be very friendly and easy to get along with. I attempted to always be mindful of both points of view, recognizing that my best opportunities to provide help would come when I was on good terms with both sides. As it turns out, being more or less in the middle, it was not difficult to see that both sides were acting in a reasonable way, so it was fairly easy to avoid picking a side outright.
I hope that sharing my experience will help people view the situation with an appreciation for both sides. For neighbors of the protestants who consider them anti-music or just plain whiners, I hope I have shown that, due to unusual topography and atmospheric issues, it’s very likely that the people next door ave different levels of sound exposure. For people who feel like Mr. Farr is a bad neighbor, I would hope that the amount of effort that was put in over the last year and a half to find workable solutions is evidence that he does have concern and is willing to compromise to find mutually beneficial solutions.
The latest news in this case that I am aware of came in June, when Judge Scudday, who presided over the TABC protest hearing, recommended to the TABC that the Nutty Brown be allowed to keep their liquor license with the provision that they maintain 75 dBA at their property line. When you consider the changes NBC has made to their venue, this seems like a fair compromise. Noise levels at the protestants’ homes should be noticeably lower now than they were in 2009. I hope that neither side is too disappointed with this outcome.



Hadn’t seen this till just now, Josh. Very fair. Very well put. Thank you for all of your help. I have learned a great deal from you. I value your expertise, impartiality and your friendship. Take care.